▤ 목차
Describing probability distributions and probability distributions with multiple variables
Describing Distributions
Variance
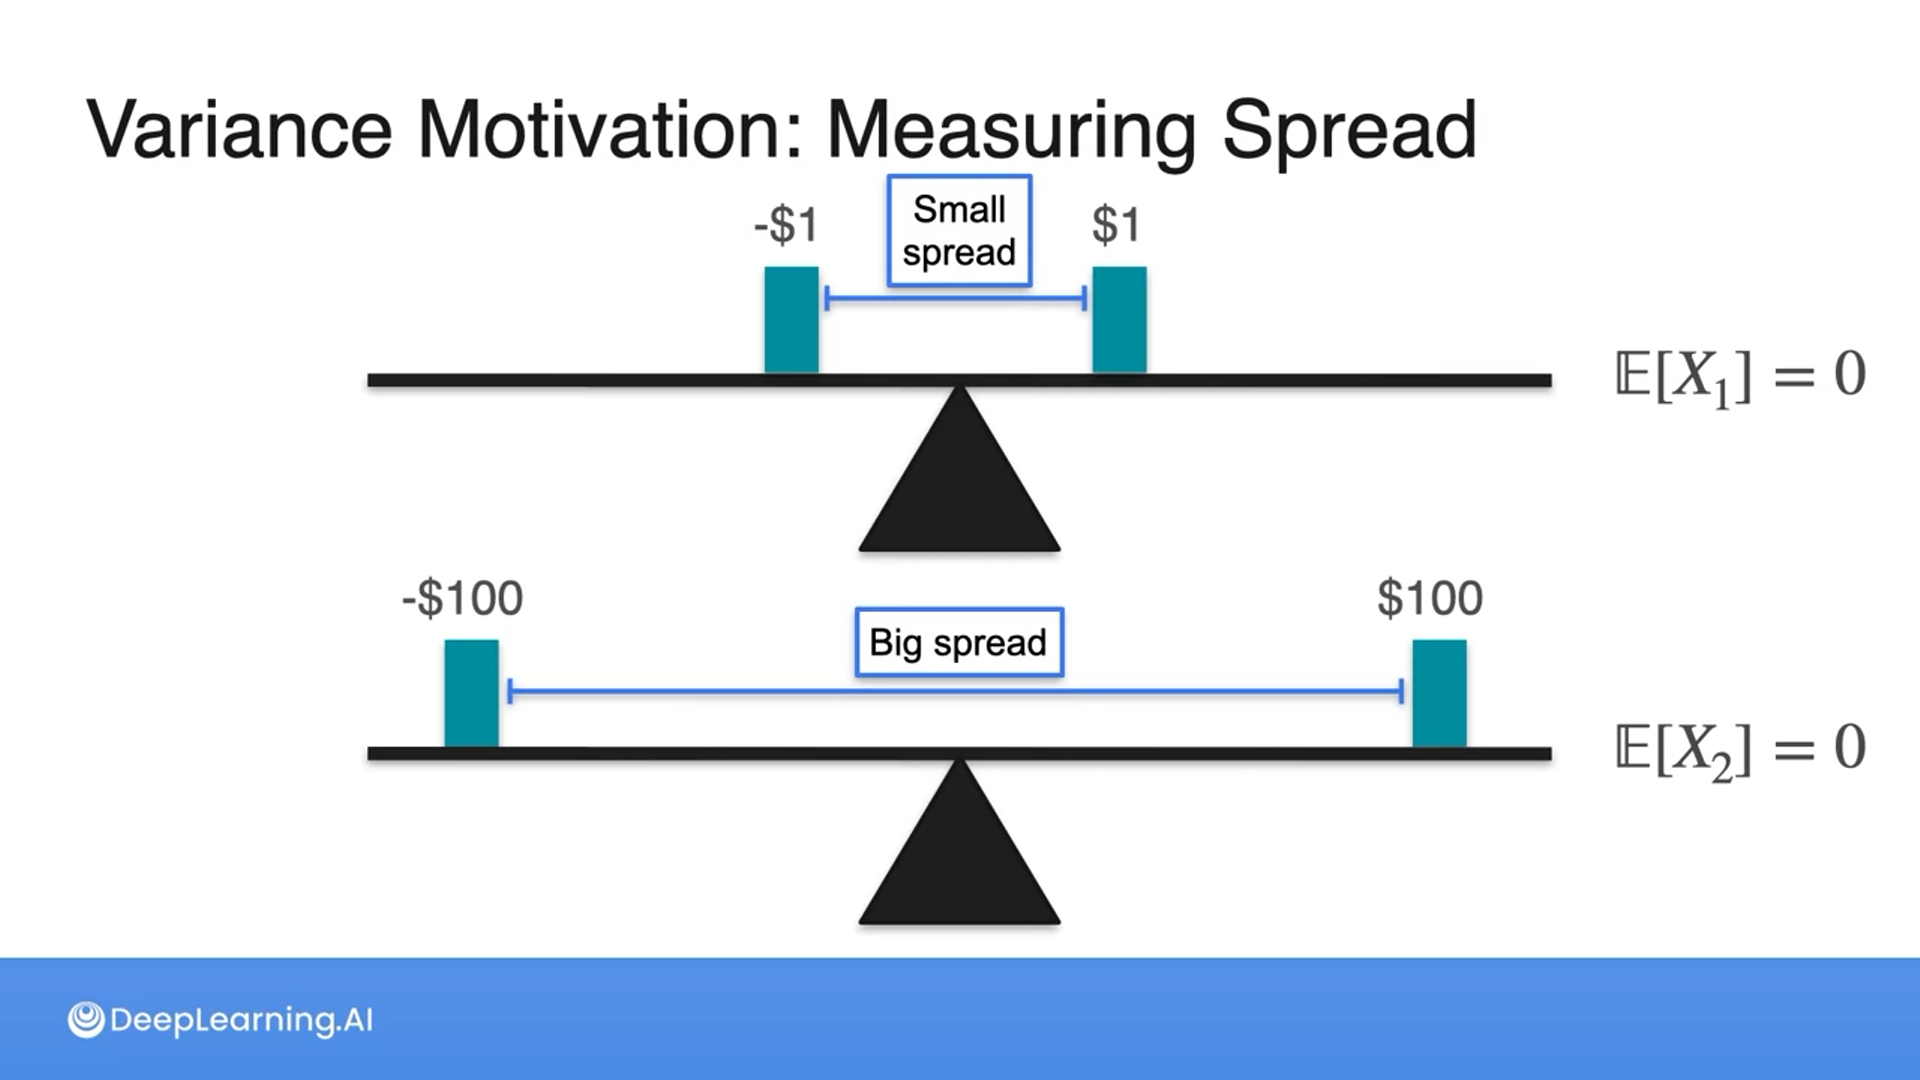
Expected values alone don’t tell us the whole story about the distributions as one can be wider or narrower than the other.
We know the spread of data through variance.

Q1: What is the maximum amount of money you should be willing to pay to play this game? Remember, you are flipping a fair coin, heads you win $1, tails you lose $1.
Q2: What is the fair amount of money to play this new game, where you flip a fair coin and win $100 if it's heads and lose $100 if it's tails?
A1: $0 is the expected value of this game.
A2:$0 is the expected value of this game.


The deviation is the difference between each point and the expected value.
Absolute deviation seems intuitive, but it gets messy mathematically, hence the more common approach is to square the differences.


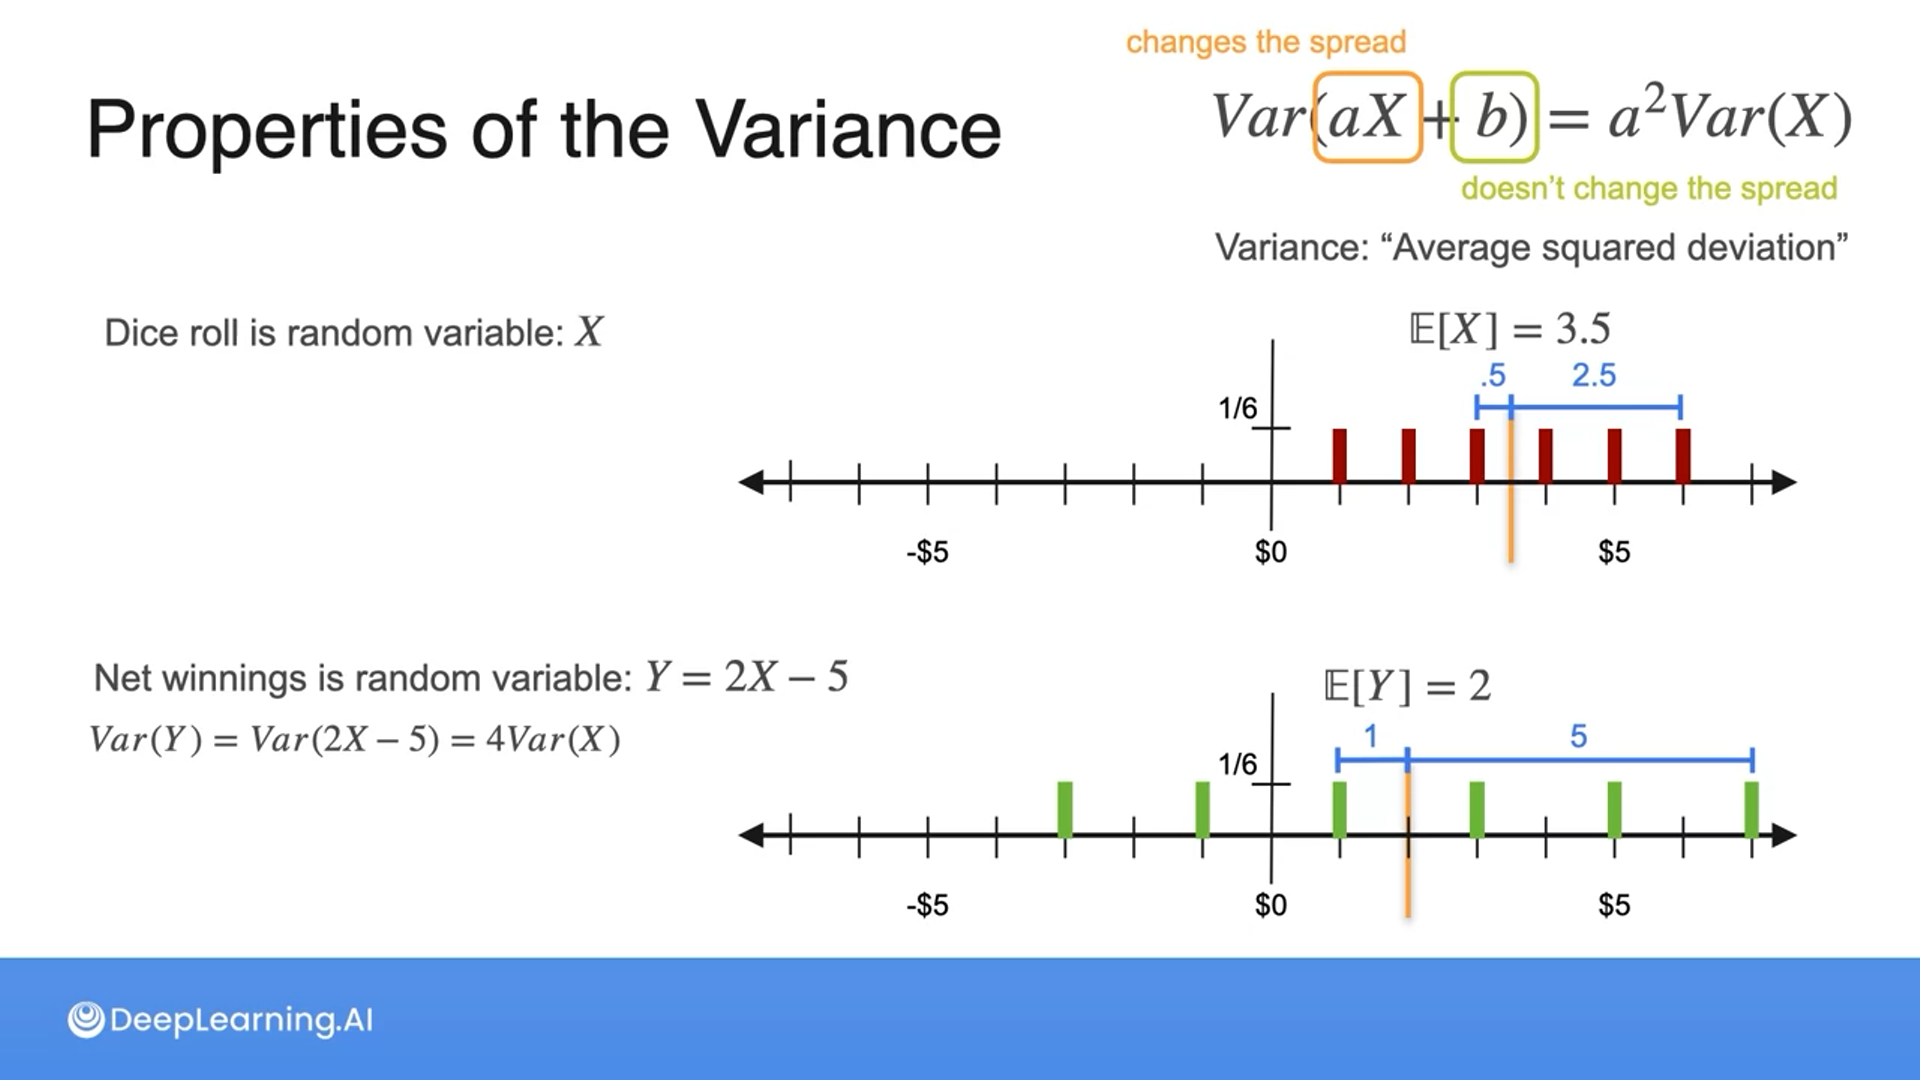
Which game has greater variance?
- Game 1: Heads you win $2, Tails you lose $2
- Game 2: Heads you win $3, Tails you lose $1Even though their expected values are different, the spread of outcomes is the same.
The games have the same variance.


The variance is the average squared deviation, so with the above example, since the deviation is twice as big, the variance is four times as big, which is equivalent to squaring the deviation, hence the formula can be updated like the following: $a^2Var(X)$
The constant in the variance doesn’t change the spread.
Adding a number (constant) to a random variable changes the point the new distribution is centered around but doesn’t impact the spread.
Standard Deviation
Variance is useful for measuring the spread of the data, but the drawback is that we can’t measure the spread when the units are different (meters, centimeters, feet, etc.).
So we take the square root of the variance, which is called the standard deviation and it’s useful in measuring the distribution using the same units of the distribution.
Given that variance is typically measured in $\text{units}^2$ (i.e. $m^2$), what operation should you perform if you require a measure of units (i.e. m)?
Take the square root.
This operation is necessary because taking the square root of the variance converts it back to the original unit of measurement.


Given a normal distribution:
- About 68% of the data falls within 1 standard deviation
- About 95% of the data falls within 2 standard deviations
- About 99.7% of the data falls within 3 standard deviations
Sum of Gaussians


If two Gaussian (normal) distributions are independent, then summing them up would make a new Gaussian distribution.
So adding the expected values together forms a new expected value for the new Gaussian distribution and adding both standard deviations forms a new standard deviation of the new Gaussian distribution.
The scaling values (the constants to be multiplied by the random variables) apply both to the expected values and variances, except with variances, the scaling values are squared beforehand.
Standardizing a Distribution
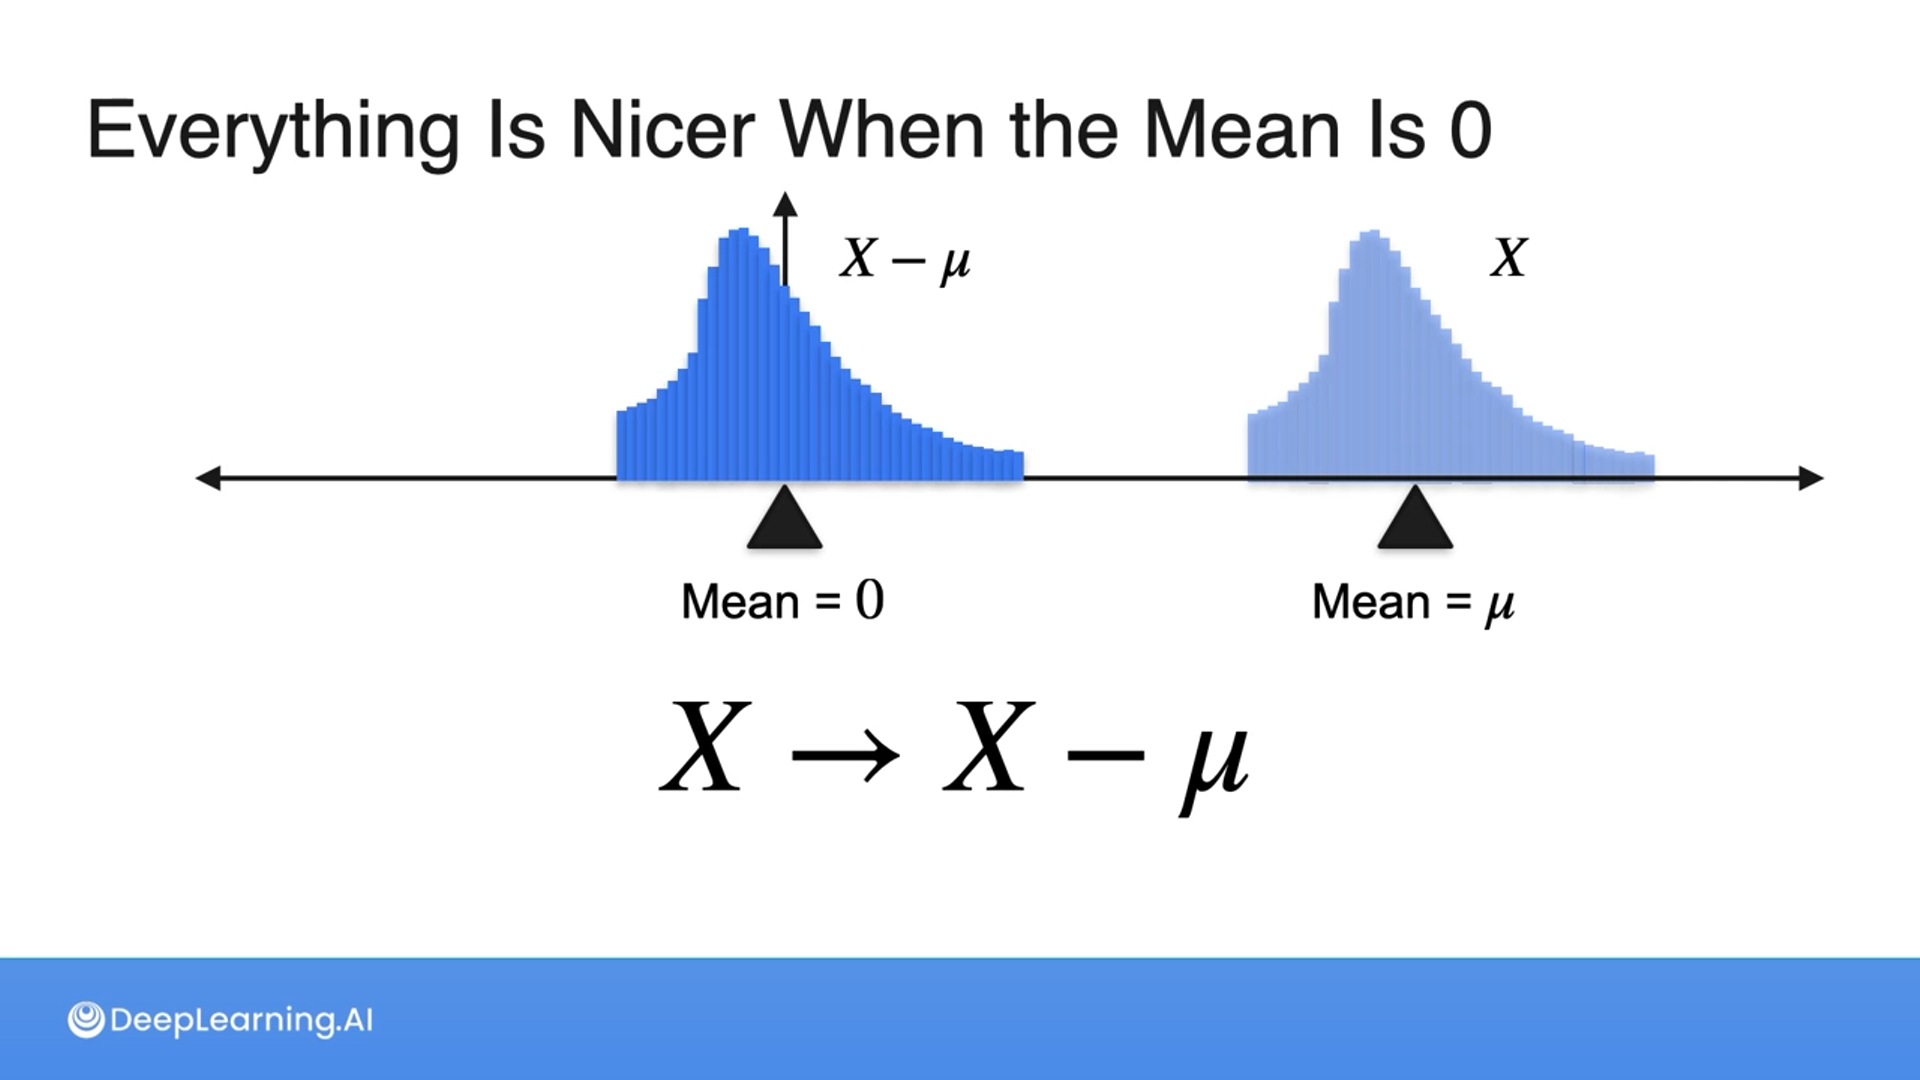
It’s always better to get the mean to be 0 and the standard deviation to be 1.


Which of the following are the benefits of standardizing a distribution?
- Comparability between different datasets
- Simplification of statistical analysis
- Improved performance of machine learning models
- All of the above
Answer
4
Great job! Standardizing a distribution has several benefits.
Firstly, it transforms datasets into a standard scale, making it easier to compare between different datasets.
Secondly, it simplifies statistical analysis, particularly when using techniques that assume a standard normal distribution.
Finally, standardizing features in machine learning can improve the convergence rate of optimization algorithms and prevent some features from dominating others, leading to improved model performance.

Standardization is when we center and scale the data to follow a normal (Gaussian) distribution.
To perform standardization, we subtract the mean and divide by the standard deviation.
Given a Gaussian distribution with $\mu=-2$ and $\sigma=4$, what is the expression for standardizing a data point from this distribution to have a mean of 0 and a standard deviation of 1?
(X + 2) / 4
The formula to standardize a variable X with mean $\mu$ and standard deviation $\sigma$ is ${X-\mu\over\sigma}$. In this case, $μ=−2$ and $σ=4$, so the correct expression for standardization is ${X+2\over4}$ which centers the distribution around a mean of 0 and scales it to have a standard deviation of 1.
All the information provided is based on the Probability & Statistics for Machine Learning & Data Science | Coursera from DeepLearning.AI


 }
}