▤ 목차
Confidence Intervals and Hypothesis testing
This week you will learn another estimation method called interval estimation. The most common interval estimates are confidence intervals; you will see how they are calculated and how to interpret them correctly. In lesson 2, you will learn about hypothesis testing where estimates are formulated as a hypothesis and then tested in the presence of available evidence or a sample of data. You will learn the concept of p-value that helps decide a hypothesis test and common tests like the t-test, two-sample t-test, and the paired t-test. You will end the week with an interesting application of hypothesis testing in data science: A/B testing.
Confidence Intervals
Confidence Intervals - Overview


We try our best to get the samples and get the estimate to follow the population by random sampling, taking larger sample sizes, and ensuring the samples are independent and identically distributed.
However, we can’t expect any particular sample to be perfectly accurate because we’d get different sample means every time.
This leads to some degree of uncertainty about how accurate it is, hence, used confidence interval.
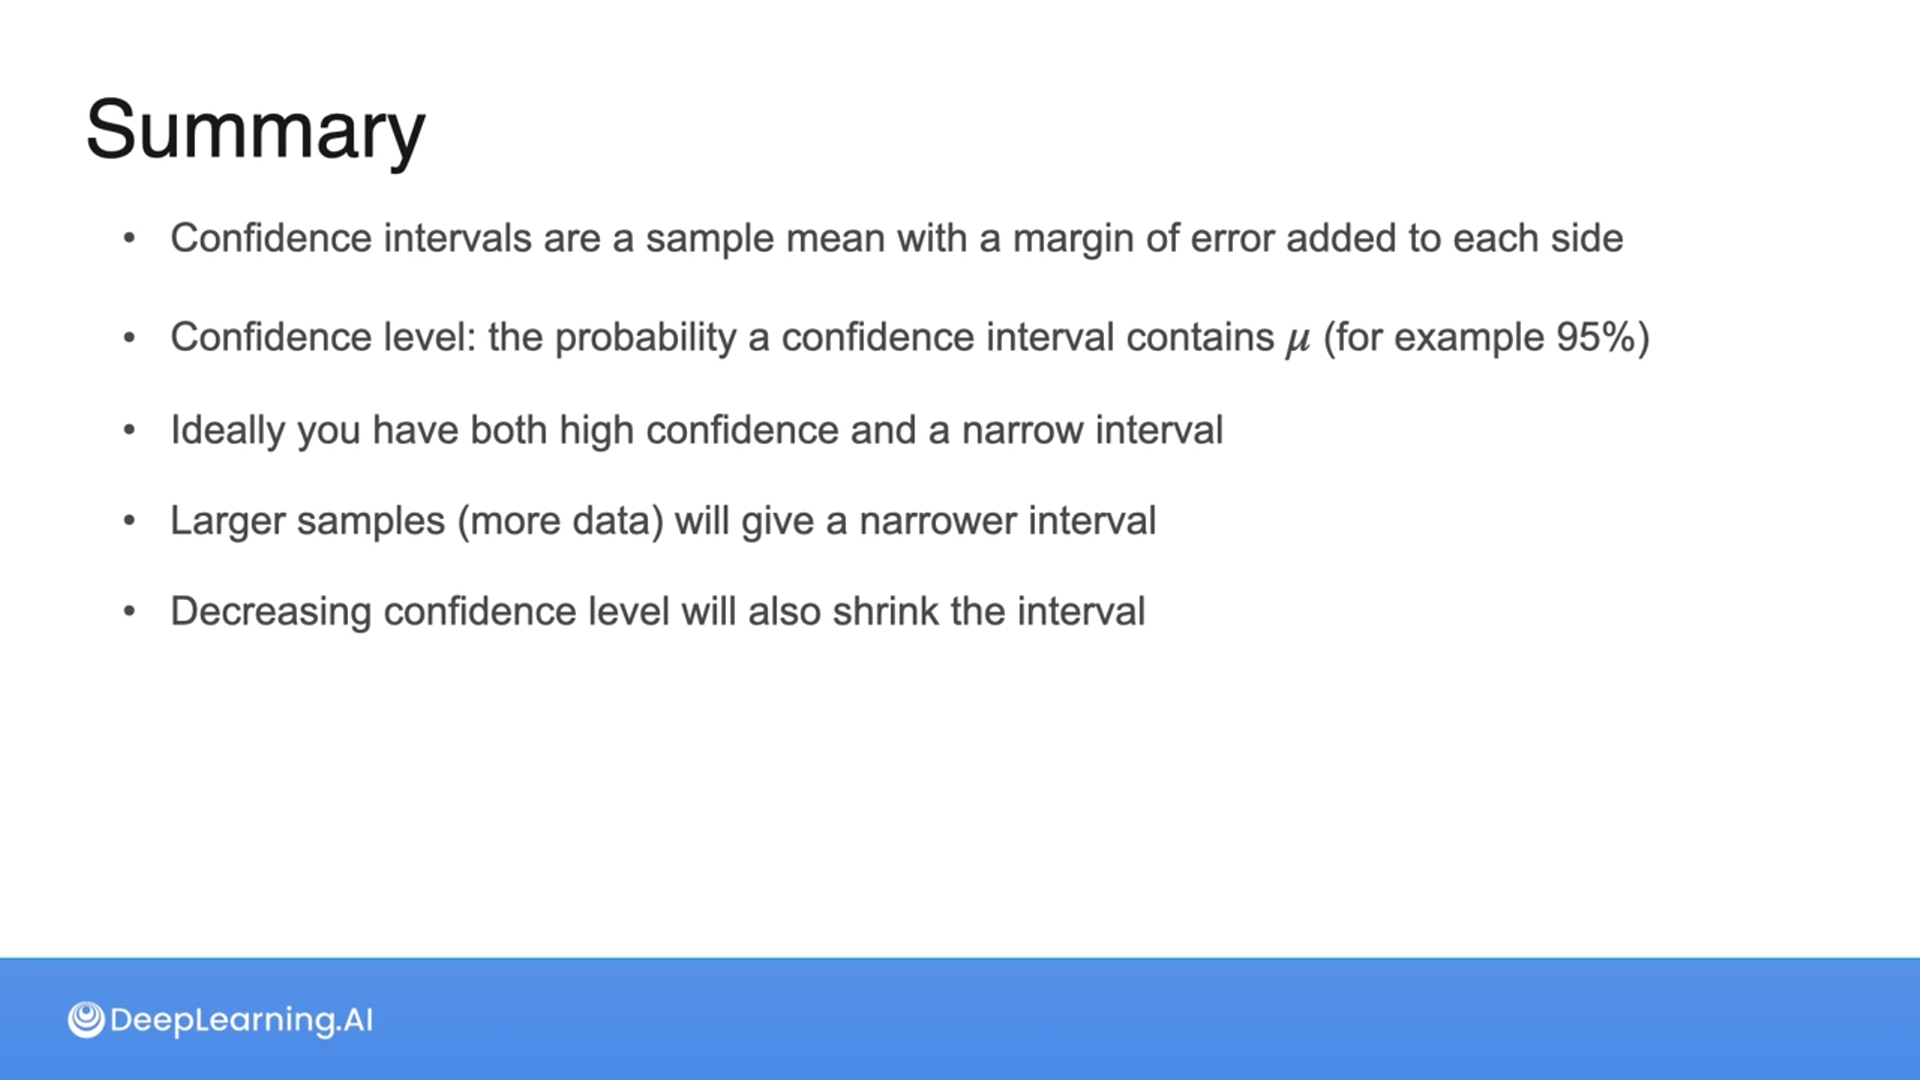
Confidence interval: An interval of values that is a lower and upper limit which contains the population parameter


In constructing a confidence interval, how does the range of values change to the percentage confidence level?
- The range of values decreases as the percentage confidence level increases.
- The range of values increases as the percentage confidence level increases.
- The range of values remains constant regardless of the percentage confidence level.
2
Great job! As the percentage confidence level increases, the range of values (width of the confidence interval) also increases. This is because higher confidence levels require capturing a larger proportion of the probability distribution, leading to wider intervals.

In this example, we assume the variance is known, the mean is unknown, and it follows the standard normal distribution.
Population mean is a fixed unknown value and we’ll randomly generate a confidence interval to estimate where it is located.
To do that we need a random sample from the population and we’ll use the random sample’s mean to estimate the population mean.
With the sample mean, we create a random variable $\bar X$ to describe the probability of selecting different sample means, which is going to be identical to $X$, a normal distribution centered of $\mu$ with a variance $\sigma^2$.
But that doesn’t mean we know the true value of $\mu$, instead, we do know $X$ and $\bar X$ have the same mean.
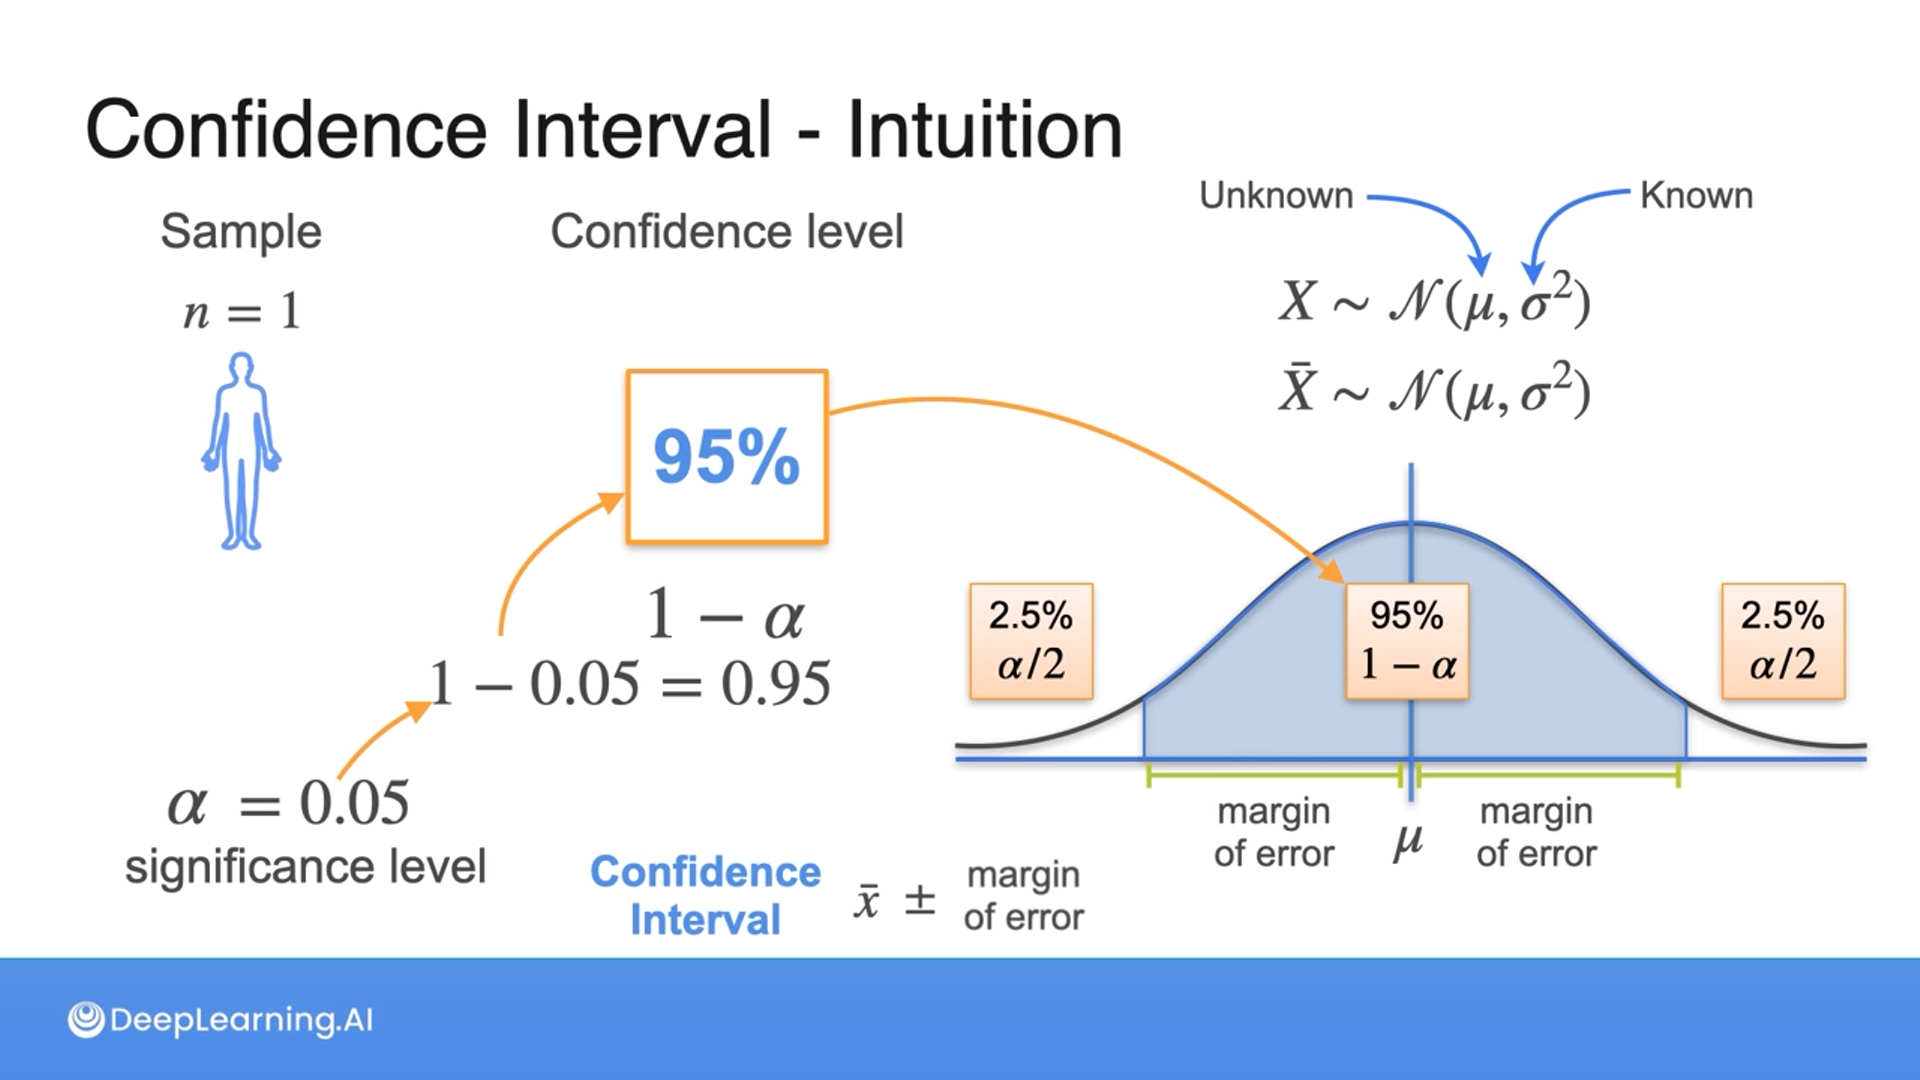
So to find $\mu$, we use two concepts: Margin of error and confidence level.
The margin of error is the distance between the sample mean and the population mean.
Confidence level is how confident we are that the sample mean will be within the range of the margin of error.
To calculate the confidence level, we use a significance level, which is the probability that the sample mean falls outside the margin of error.
So the formula for the confidence interval is sample mean plus minus the margin of error.
It means that if the sample mean is one of the 95% of all sample means that is relatively close to $\mu$, then $\mu$ is also relatively close to the sample mean.
We can think of the confidence interval as a bet, unless unlucky, $\mu$ should be pretty close to the sample mean, hence sample mean and population mean are close to each other.


It shows that 95% of the time the confidence interval contains the population mean.
However, we do not generate hundreds of confidence intervals and we do not know the population mean.
We generate a single confidence interval and due to the probabilities in the confidence interval, we know that 95% of generated confidence intervals will contain the population mean.
Confidence Intervals - Changing the Interval


No matter the size of the sample, the sample mean will always be equal to the population mean and the sample deviation will depend on the sample size.

What will happen to the margin of error as sample size n increases?
The margin of error will decrease.
Great job! Increasing the sample size at the same confidence level typically decreases the margin of error. This is because larger sample sizes provide more precise estimates of the population parameter, resulting in a smaller margin of error while maintaining the same level of confidence.

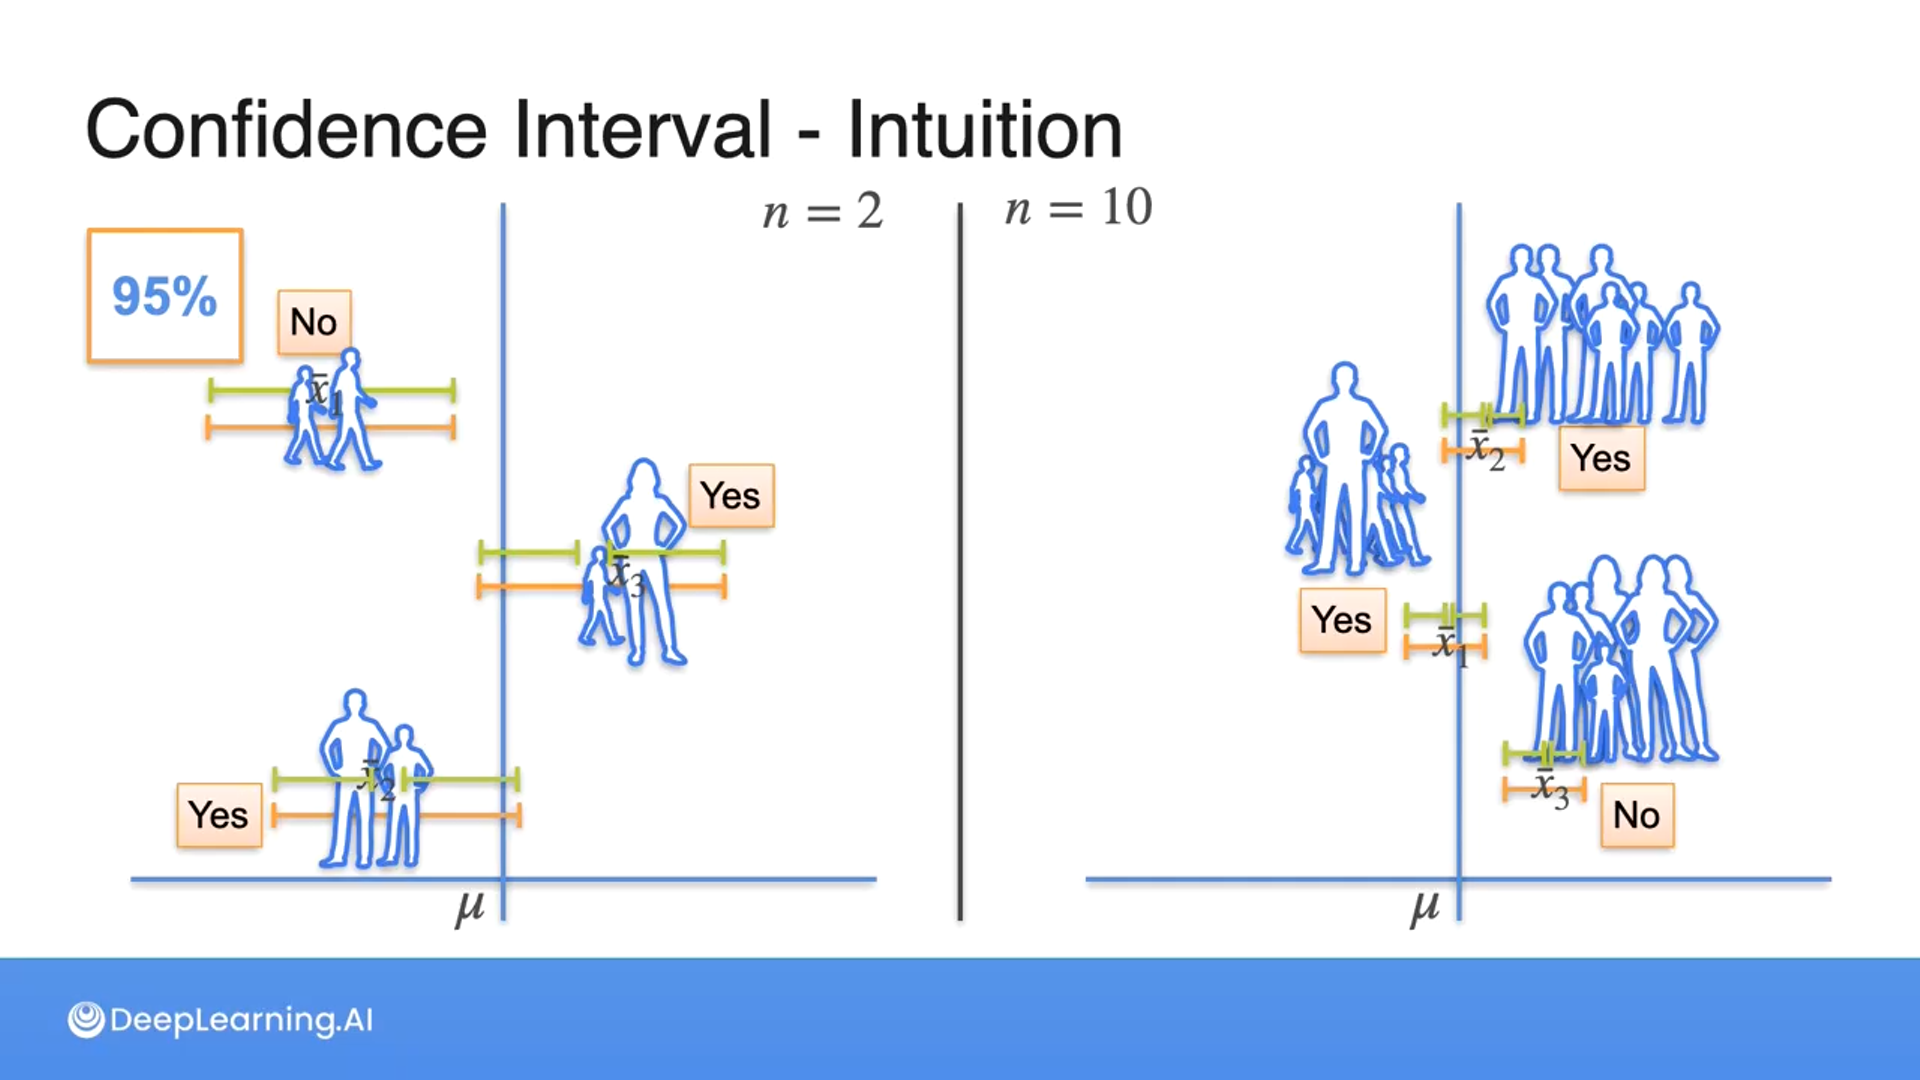

As the sample size increases, the confidence interval decreases if we were to compare the same confidence levels due to having greater accuracy.


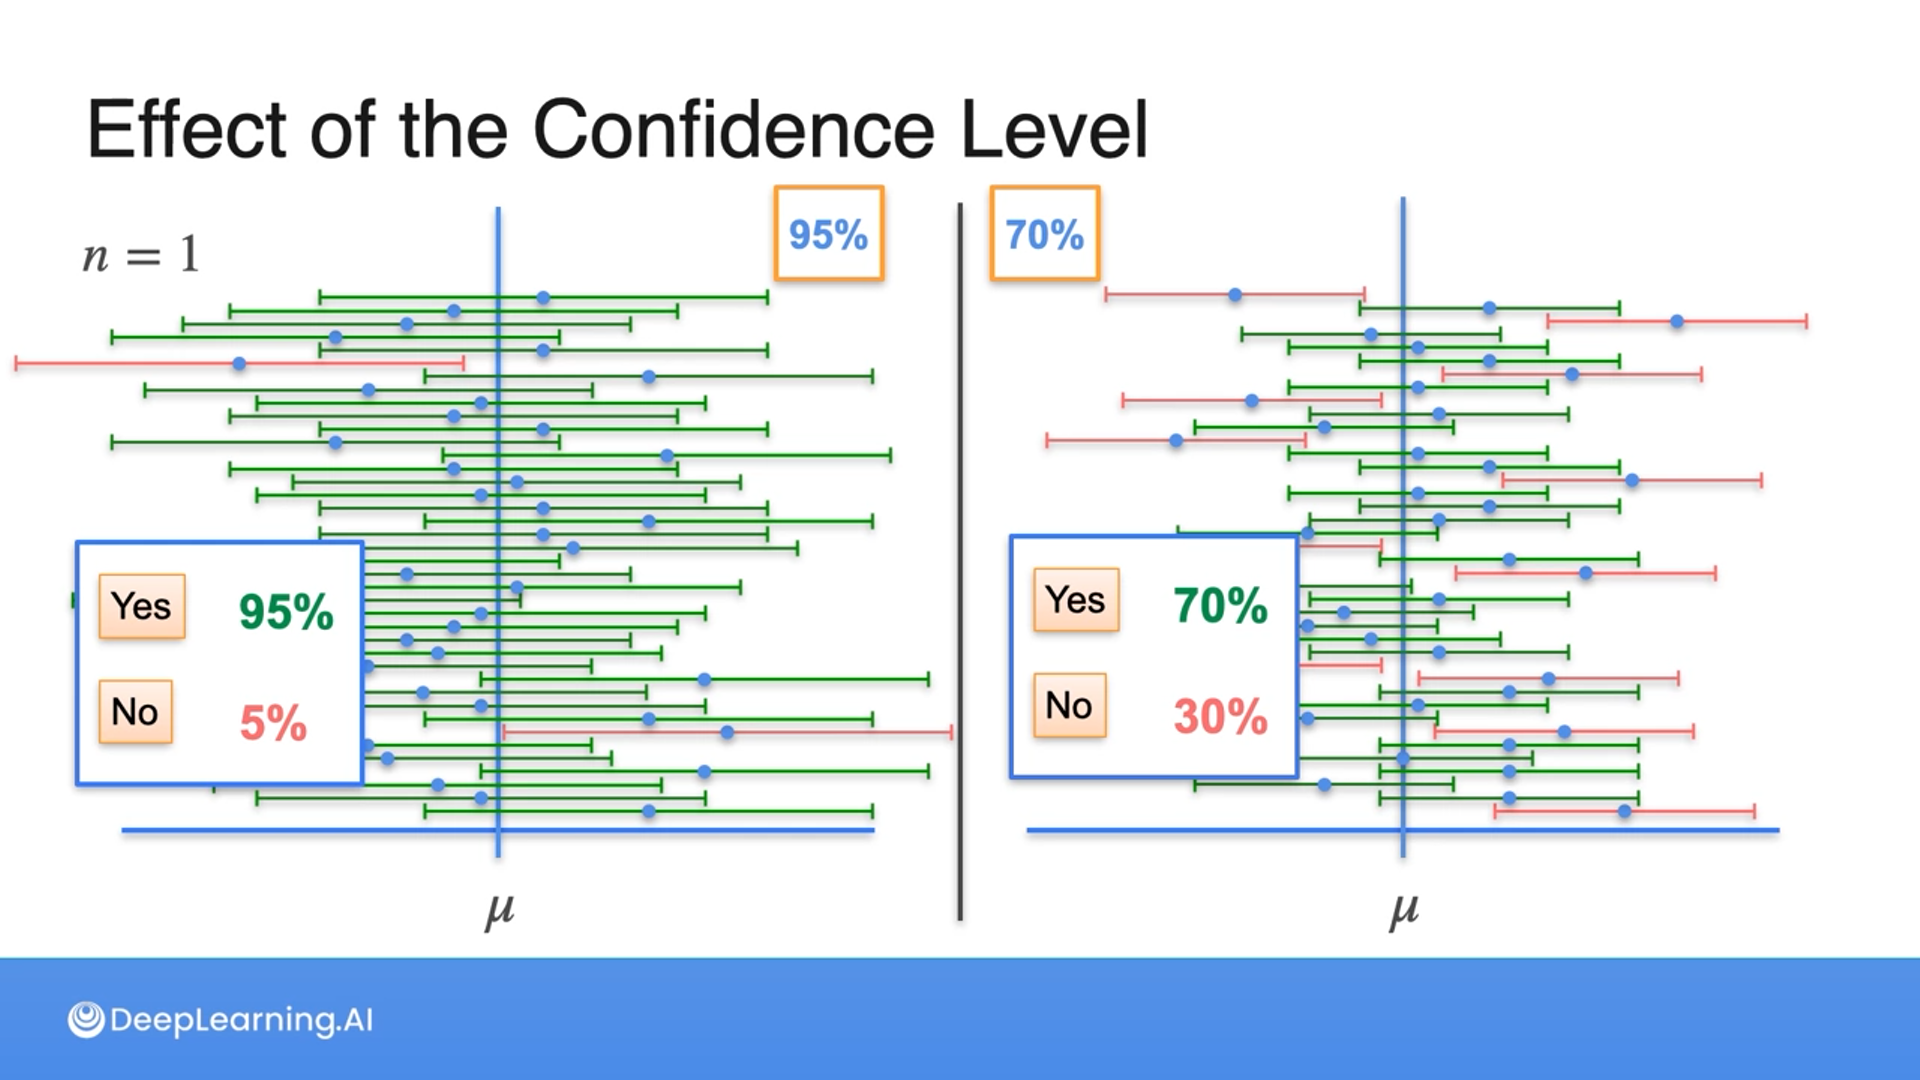
Increasing the confidence level means decreasing the confidence interval with more samples or increasing the confidence interval with the same sample size.
A lower confidence level means we are shrinking the confidence interval with the same sample size.
Confidence Intervals - Margin of Error


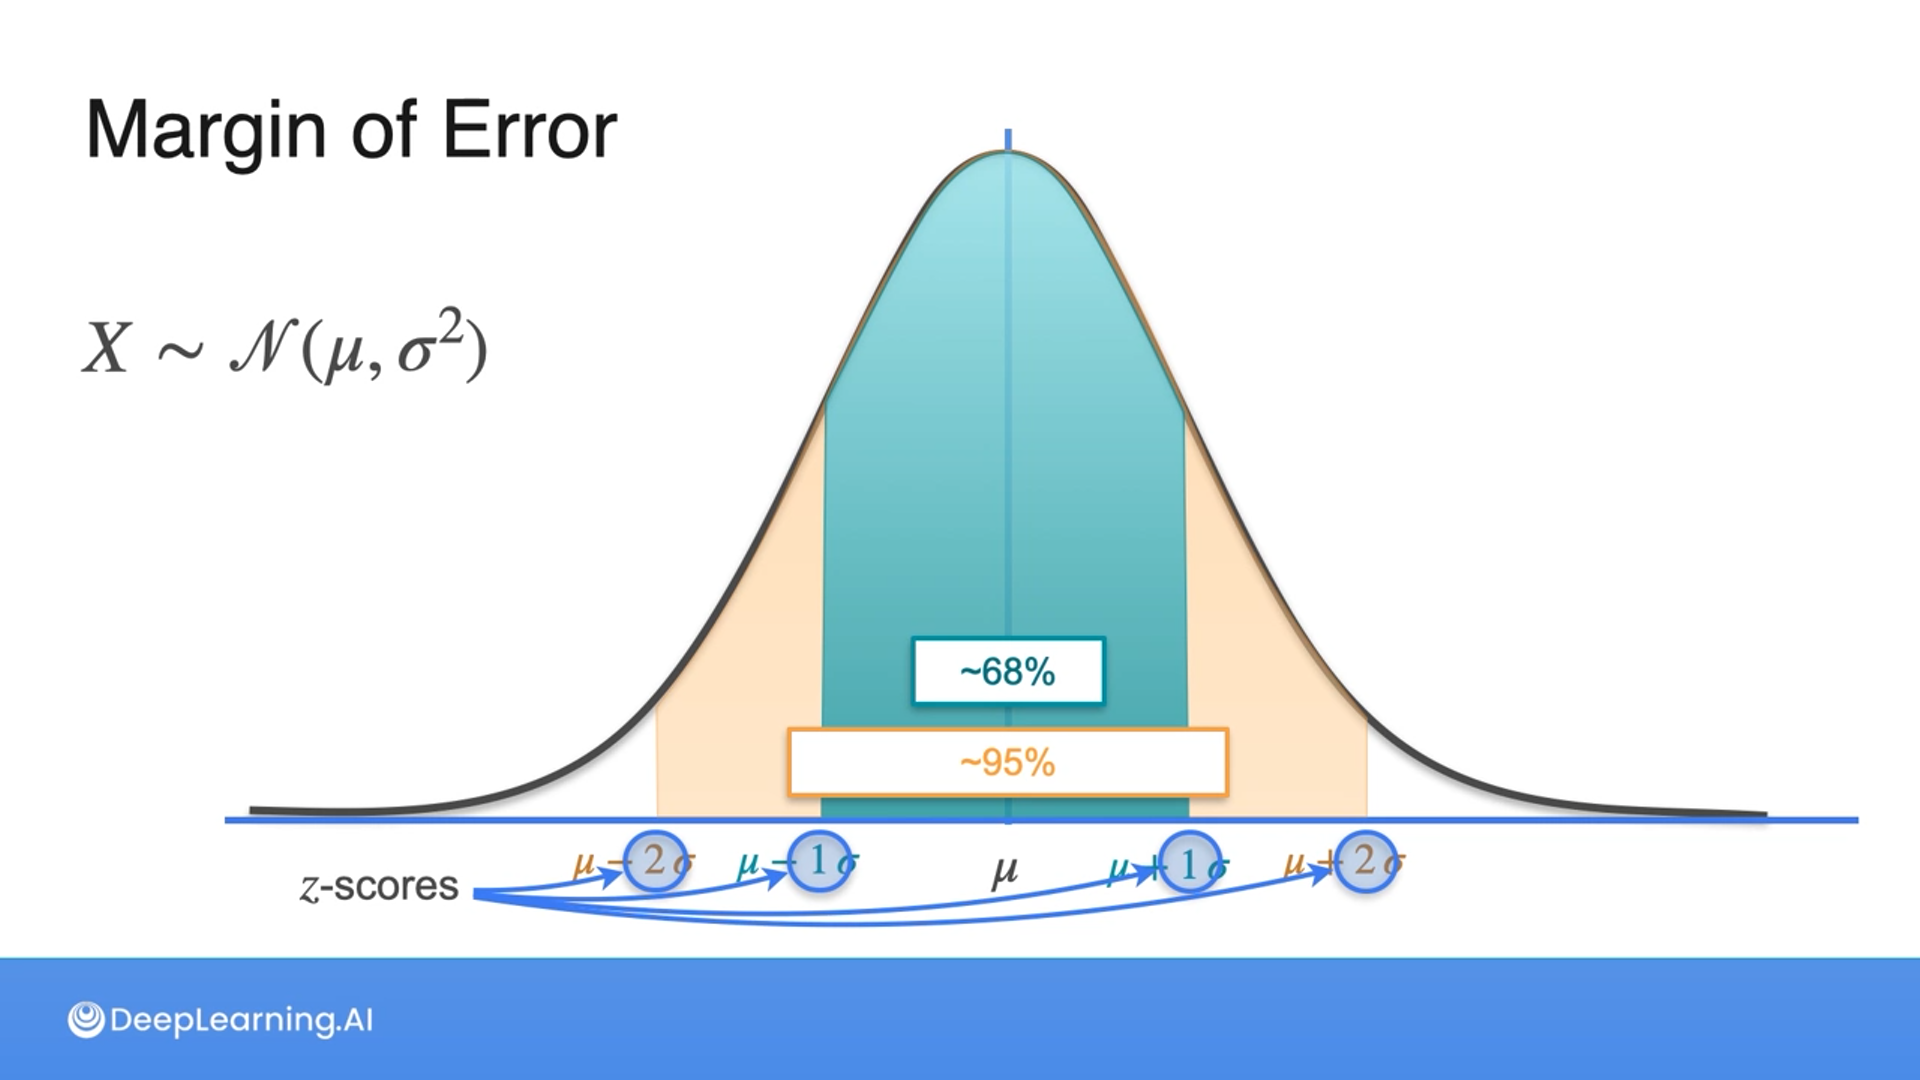
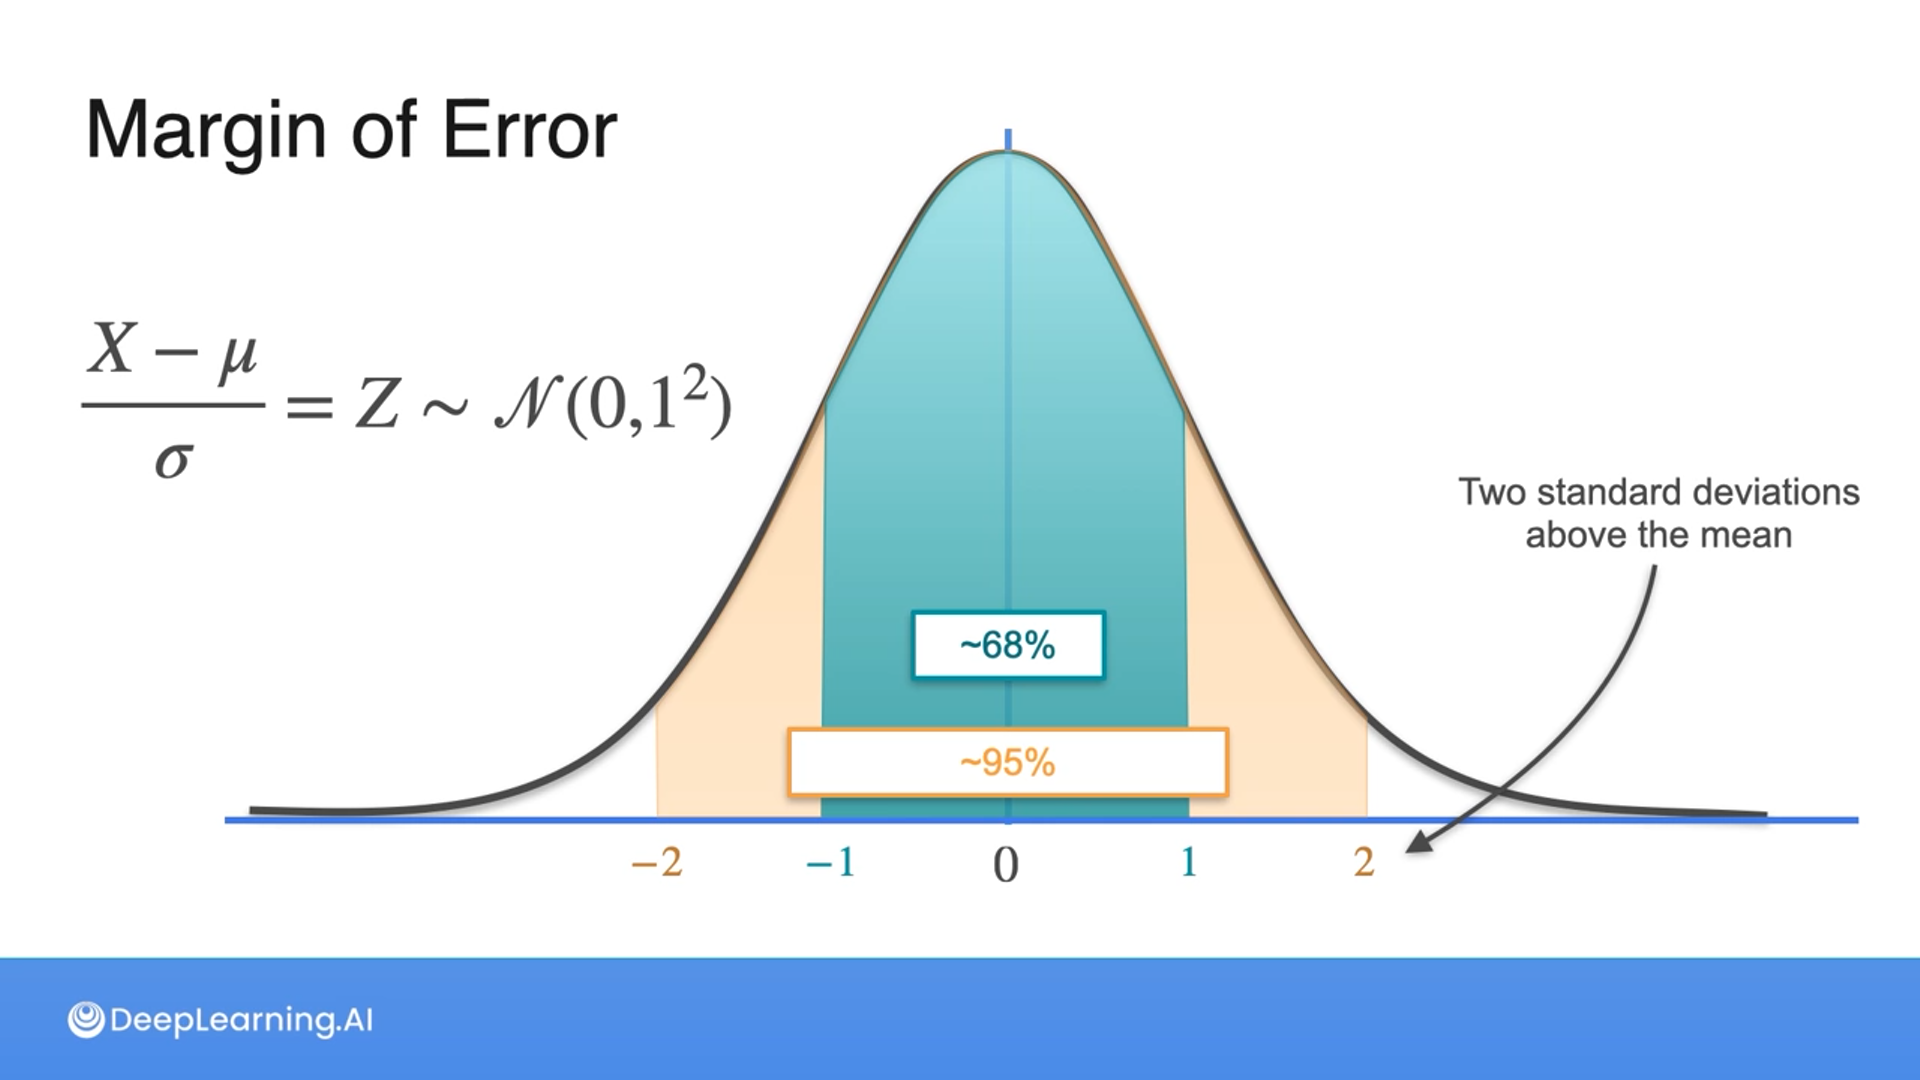

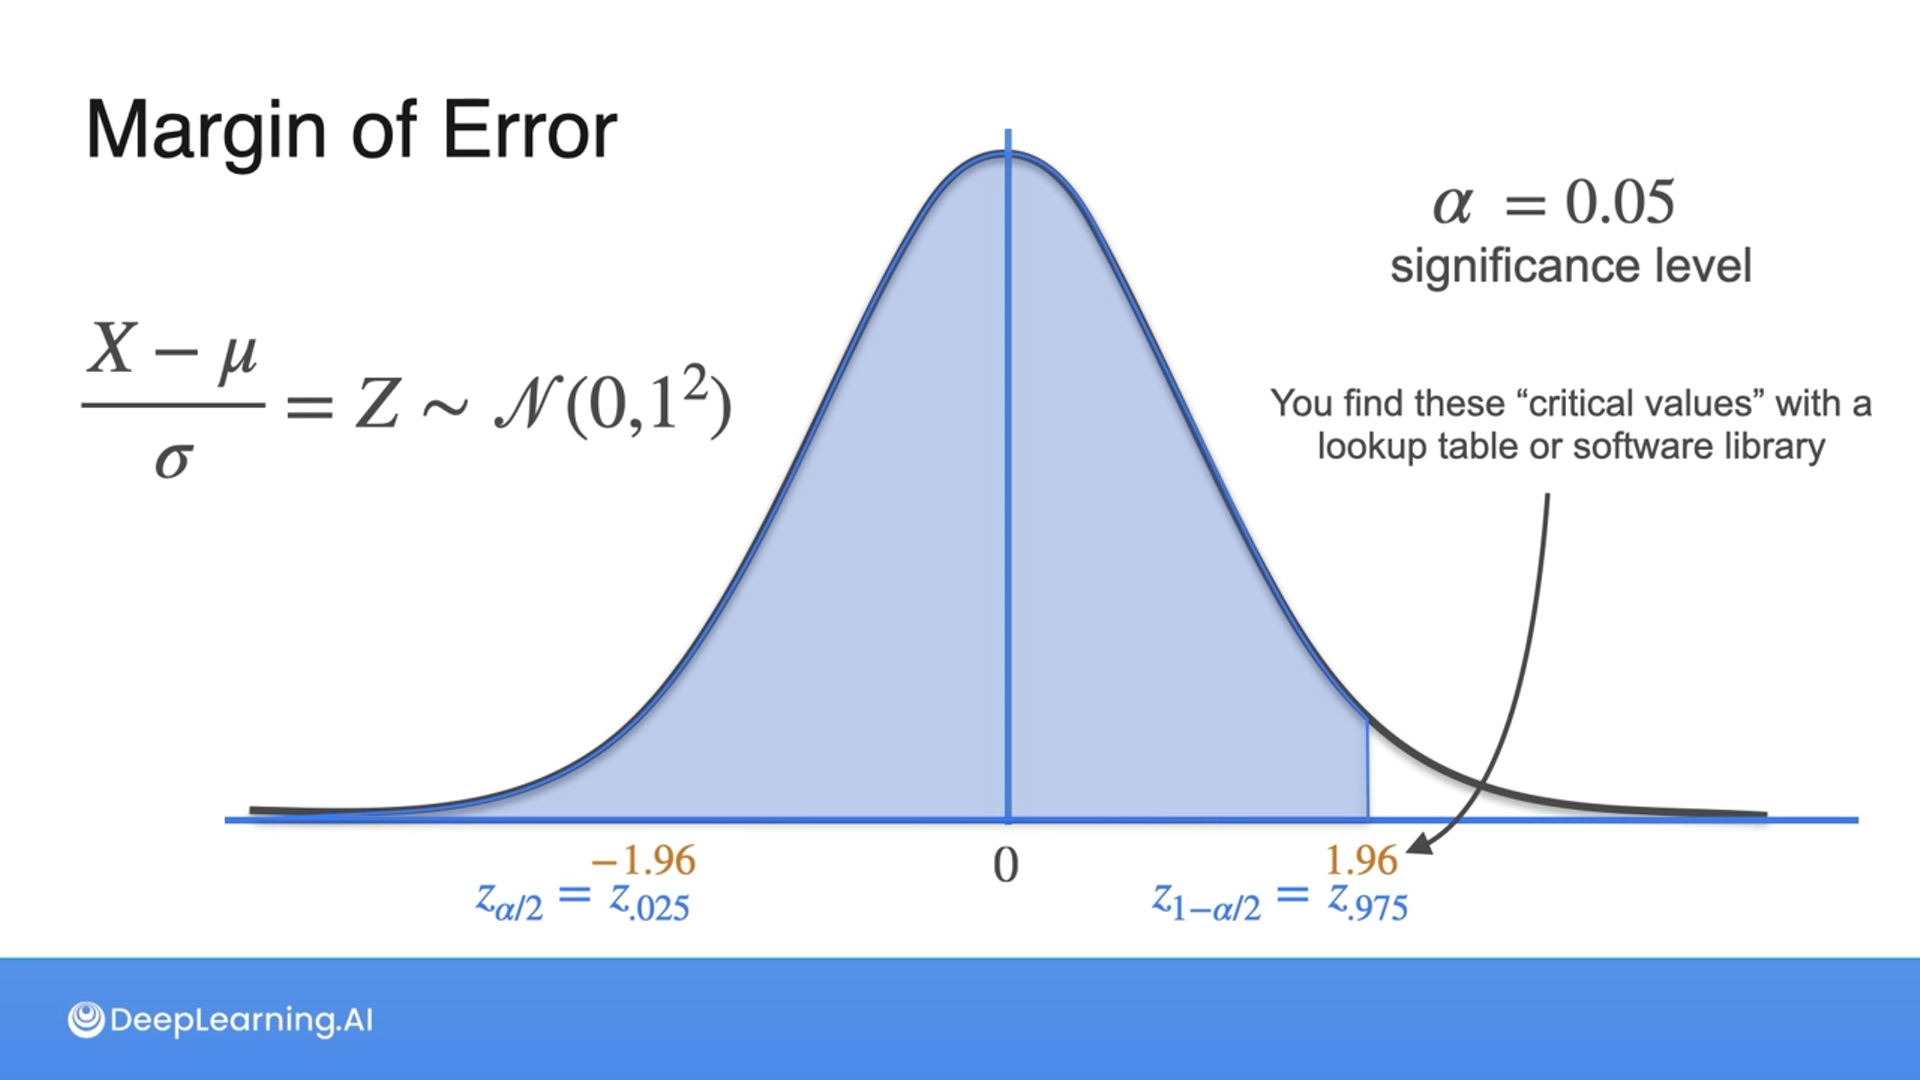


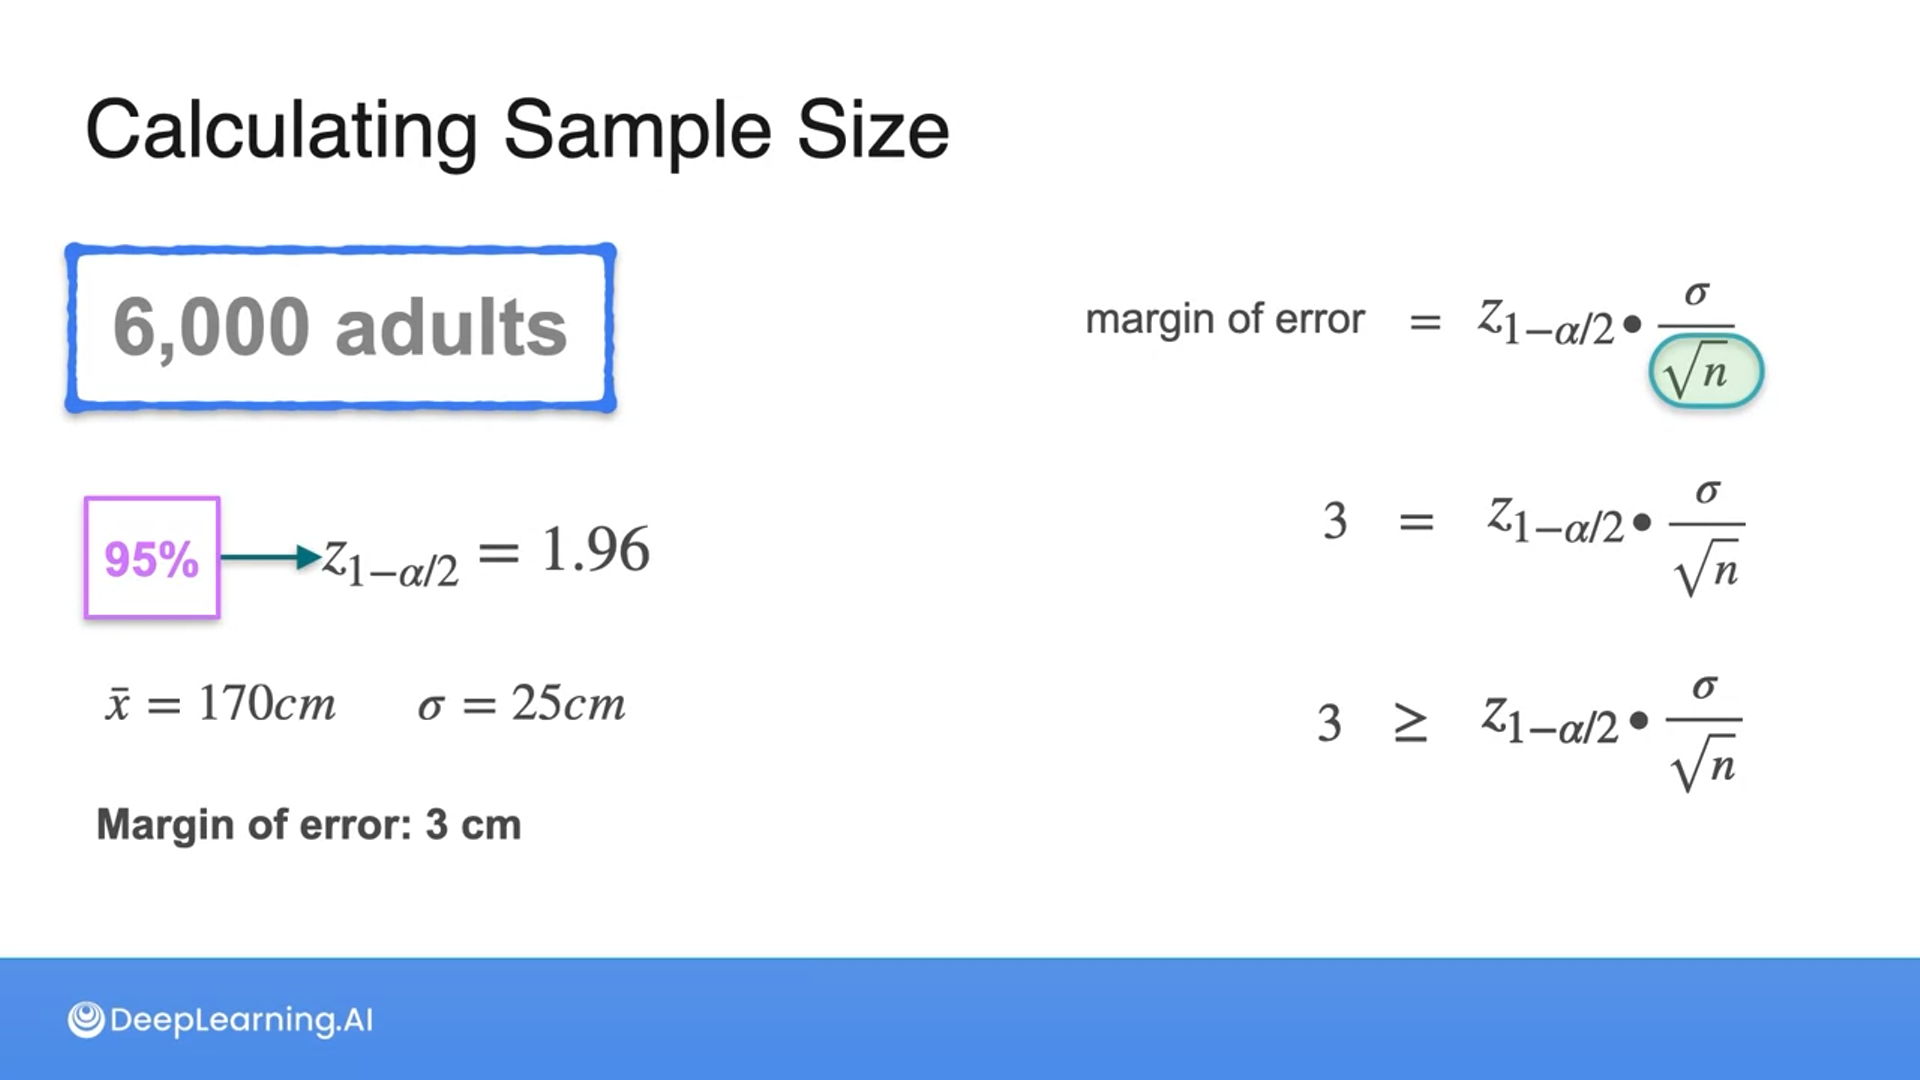
The margin of error is determined by the sample size and the confidence level.
This is done due to knowing that under normal distribution, 68% of the data falls within 1 standard deviation and 95% of the data falls within 2 standard deviations.
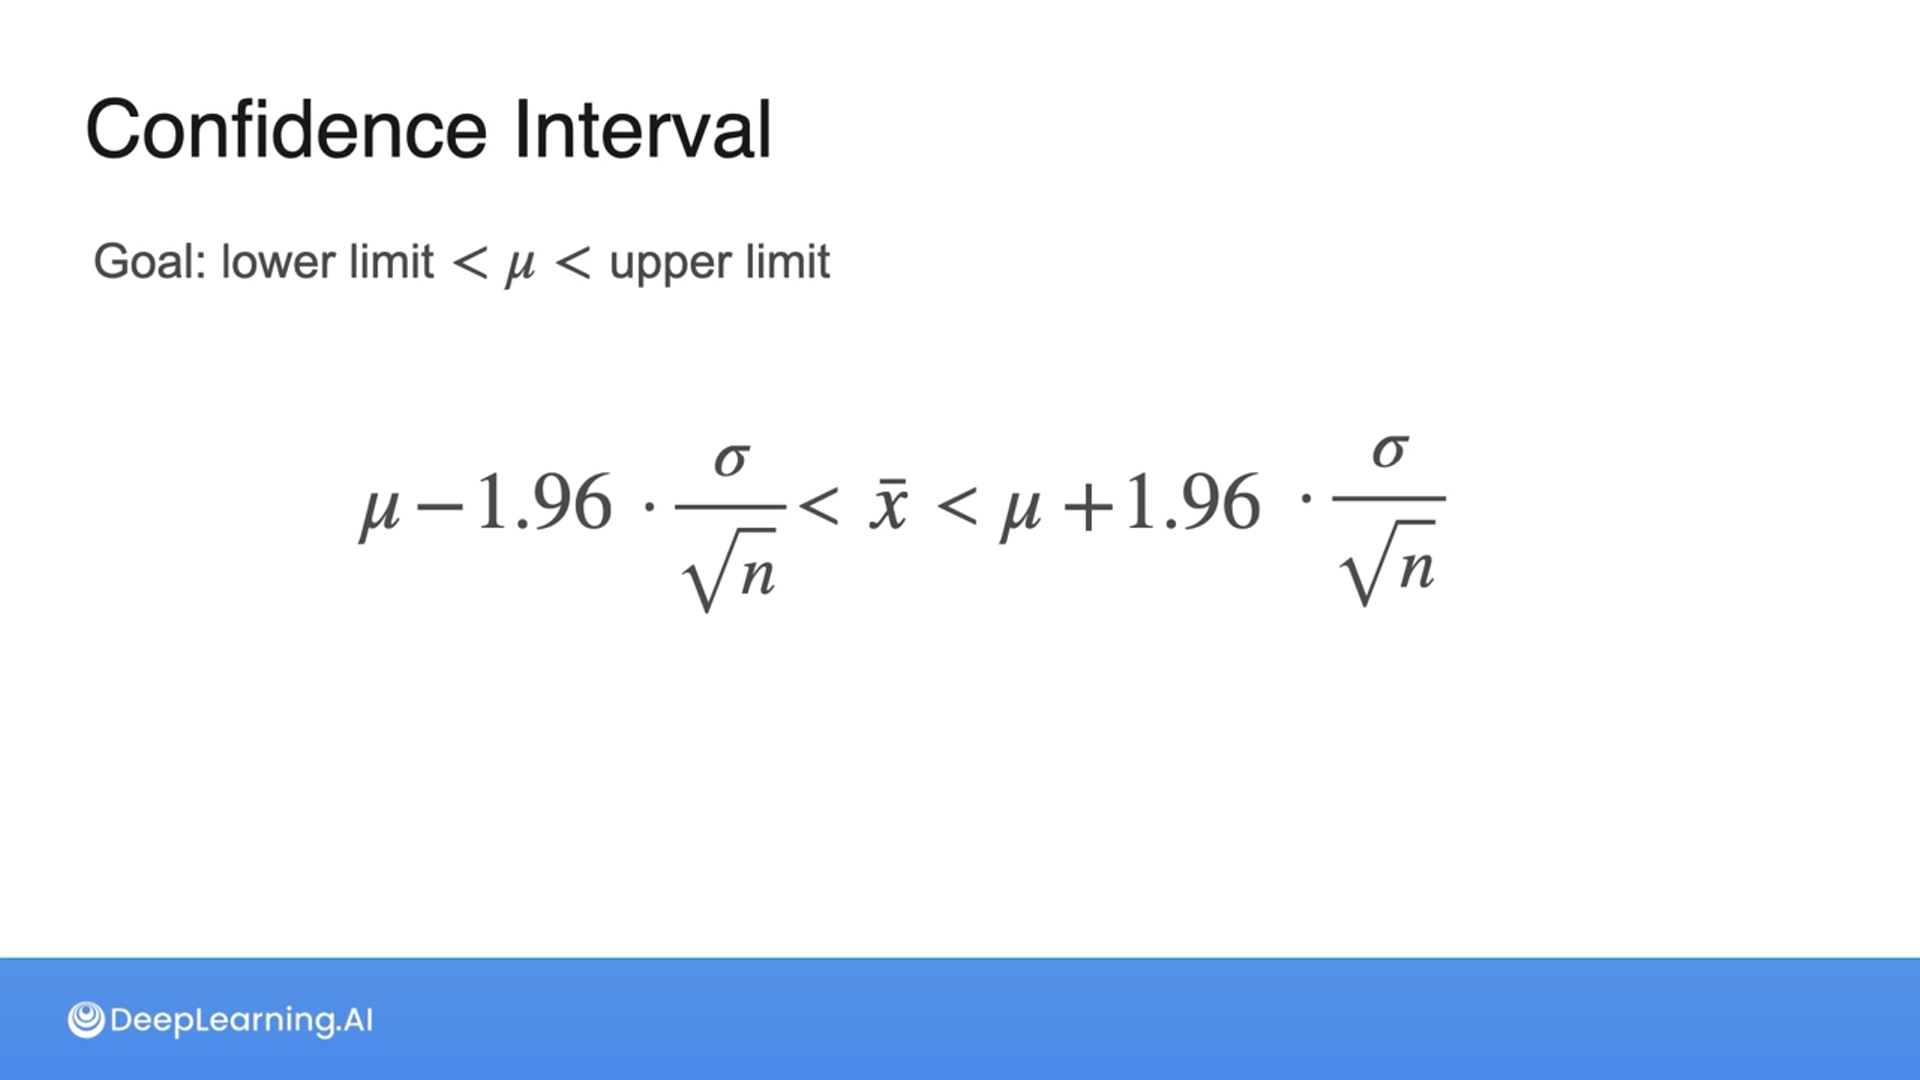


Then we add and subtract it from the sample mean to get the lower and upper limit of the confidence interval.
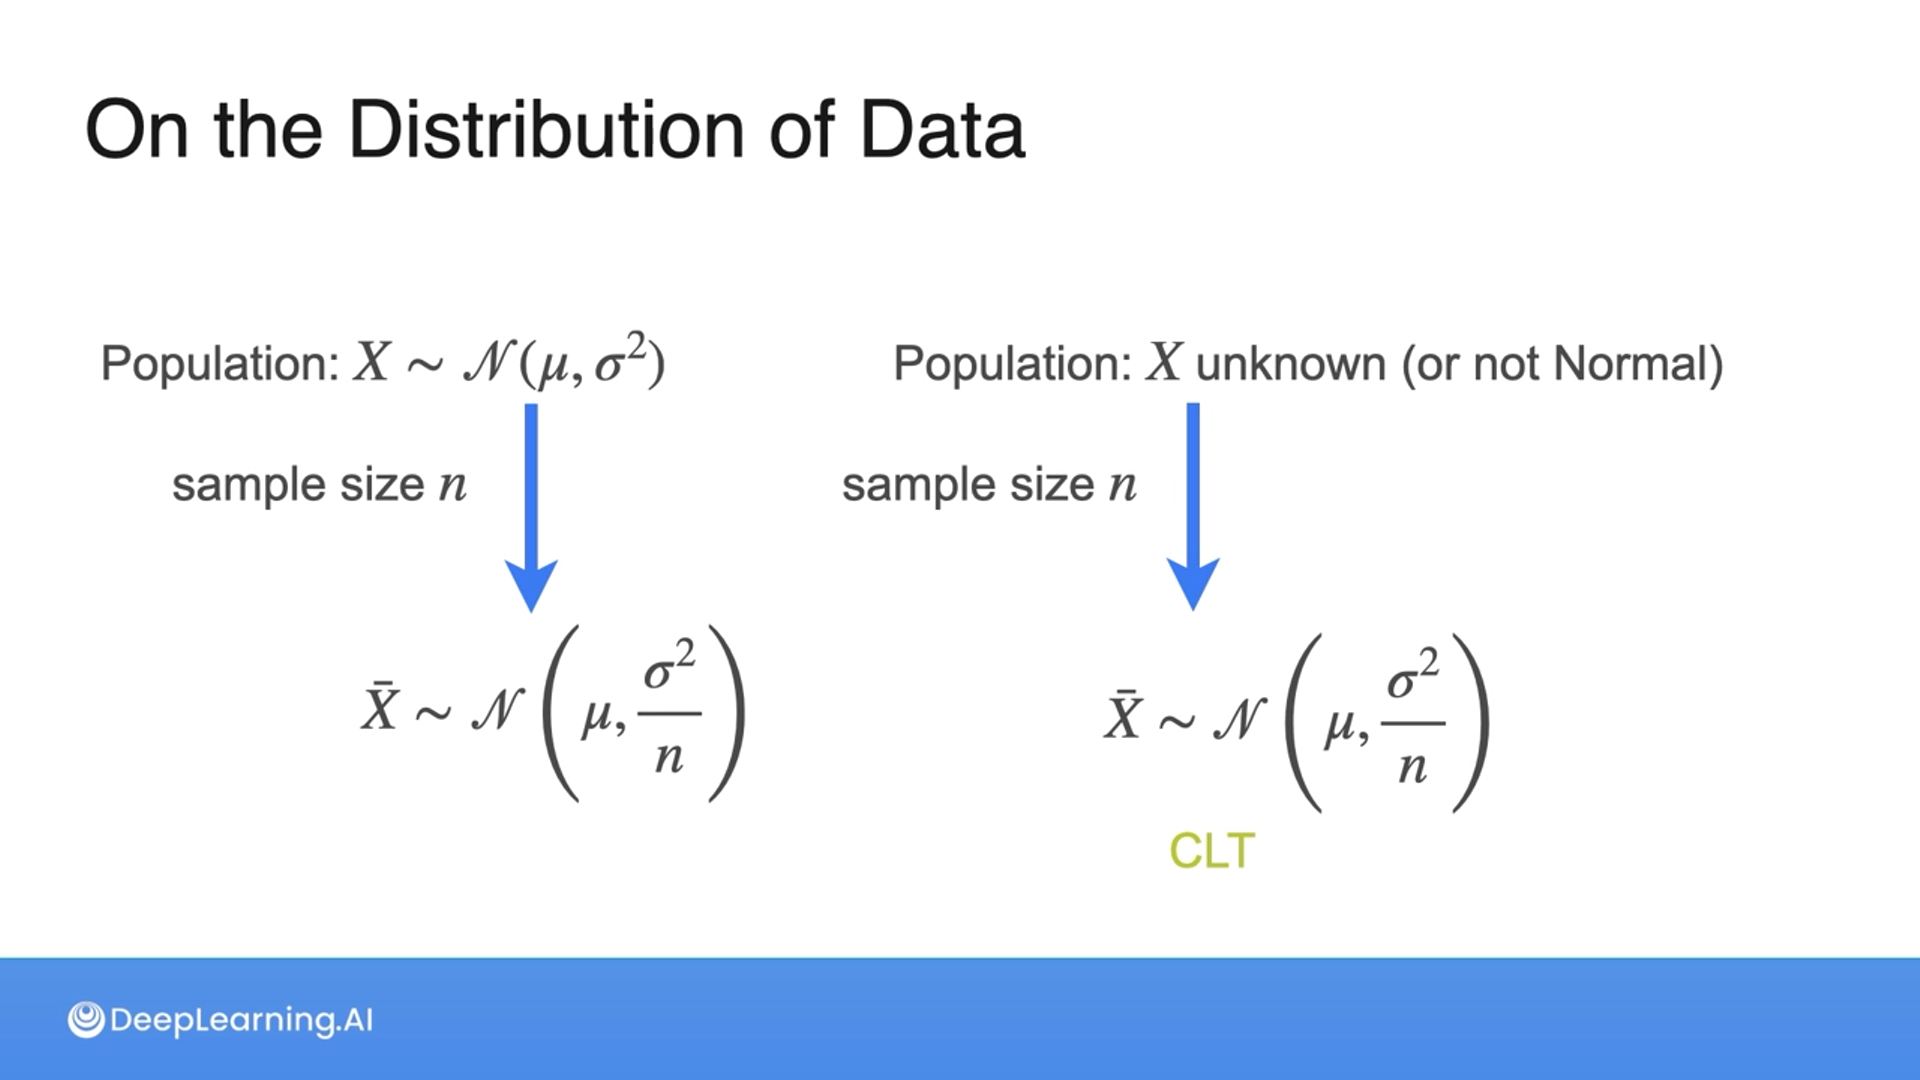
Due to the central limit theorem (CLT), even if we don’t know the distribution of the population, the sample mean will follow the normal distribution as n gets larger and will still have the same parameters $\mu$ and ${\sigma^2\over n}$.
Confidence Intervals - Calculation Steps


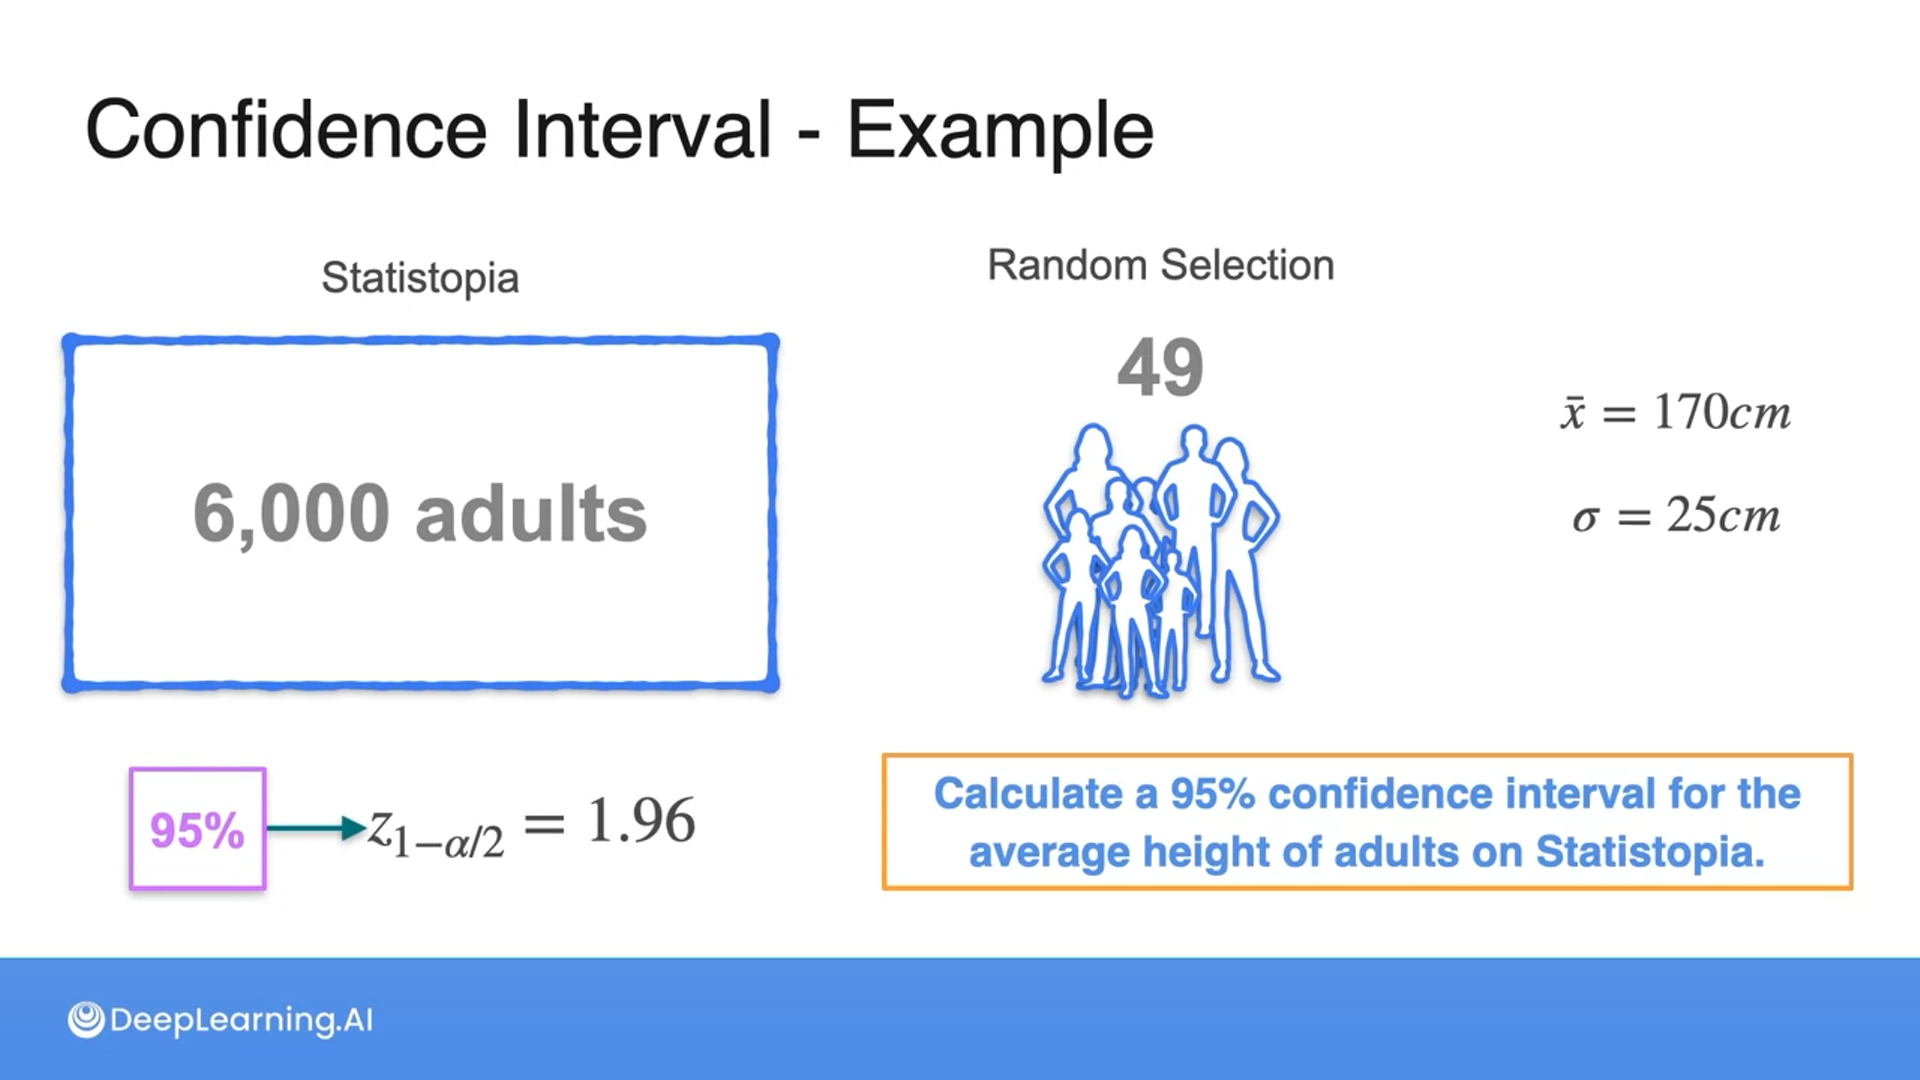
Confidence Intervals - Example


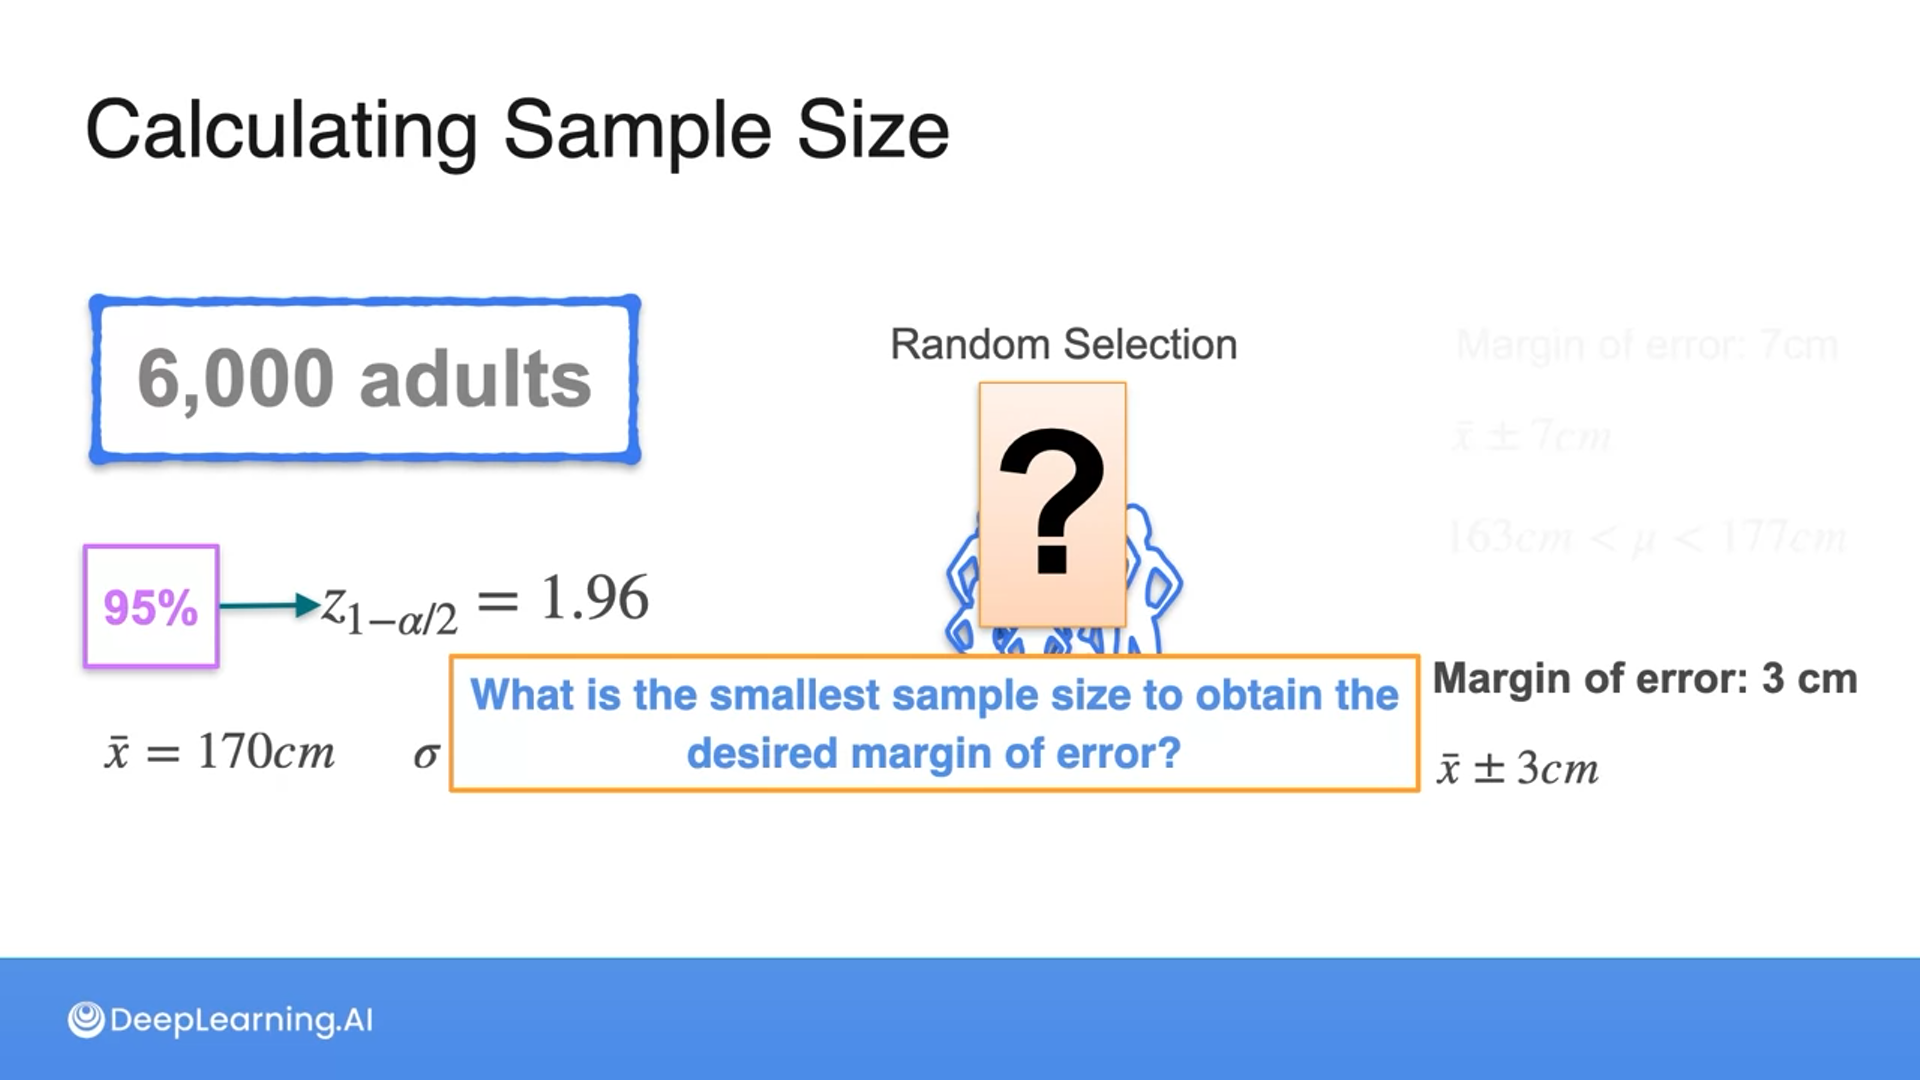
Calculating Sample Size



All the information provided is based on the Probability & Statistics for Machine Learning & Data Science | Coursera from DeepLearning.AI


 }
}