▤ 목차
Describing probability distributions and probability distributions with multiple variables
Quiz
Q1
Consider the four sets of samples above. Which one has the smallest variance?
$$ \begin{array}{c|cccc}\hline \text { Set } & \text { Values } & & & \\ \hline 1 & 1 & 5 & 7 & 9 \\2 & -20 & -10 & 0 & 10 \\3 & 100 & 101 & 102 & 103 \\4 & -10 & -5 & 0 & -5 \\\hline\end{array} $$
- 1
- 2
- 3
- 4
Answer
3
The variance measures how much a sample is spread. We can easily look at all the samples and check that this one has the smallest spread.
Q2
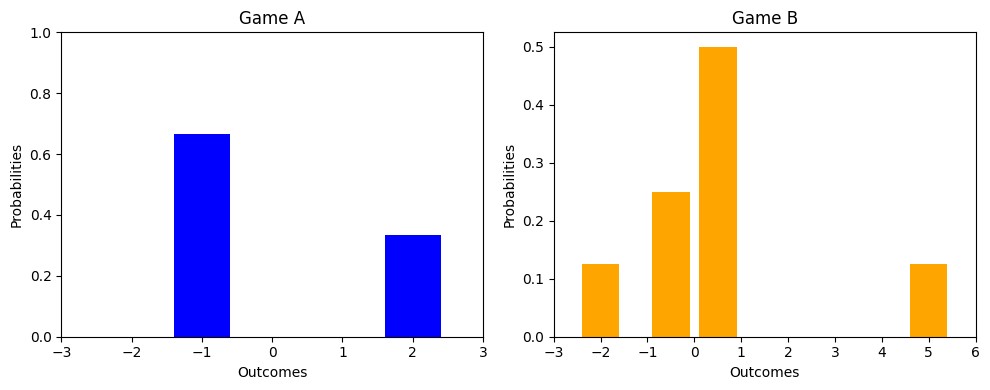
Consider two games, Game A and Game B, each with different probability distributions of winnings and losses. Game A has a probability of 1/3 to win $2 and a probability of 2/3 to lose $1. Game B has a probability of 1/2 to win $0.50, a probability of 1/4 to lose $0.50, a probability of 1/8 to win $5, and a probability of 1/8 to lose $2.
Which of the following statements is true?
- Both Game A and Game B have the same kurtosis.
- Game A's kurtosis is smaller than Game B's kurtosis.
- Game B's kurtosis is smaller than Game A's kurtosis.
Answer
2
Kurtosis measures the shape and thickness of the rails of a probability distribution. A larger kurtosis indicates thicker tails and more extreme values. In this case, Game Y has a larger kurtosis because it has thicker tails due to the presence of extreme values (winning $5 or losing $2 with small probabilities).
Consider the following independent random variables:
$$ X \sim \text{Normal}(3,1)\\ Y \sim \text{Normal}(2,2) $$
Then $Z=X+Y \sim \text{Normal}(\mu,\sigma)$, where $\mu, \sigma$ are equal to:
- $\mu=\sqrt5, \sigma=\sqrt3$
- $\mu=5, \sigma=\sqrt5$
- $\mu=5, \sigma=\sqrt3$
- $\mu=5, \sigma=5$
Hint
Remember the formula for a sum of independent Gaussians, $\mu Z = \mu X + \mu Y$, and $\sigma Z = \sqrt{\sigma^2X + \sigma^2Y}$
Answer
2
Q4
Consider the following box plot for the test scores of two classes, A and B:

Which of the following statements is true?
- Class B's interquartile range (IQR) is larger than Class A's interquartile range.
- Class B's median score is higher than Class A's median score.
- Class A's interquartile range (IQR) is larger than Class B's interquartile range.
- Class A's median score is higher than Class B's median score.
Answer
2
Looking at the box plot, we can see that the median of Class A is around 75, while the median of Class B is around 85.
3
The rectangle in A is bigger than B.
Q5
Consider the following QQ plot for a set of data:

Which of the following statements is true?
- The data has a lower variance than a normal distribution.
- The data is not normally distributed.
- The data looks normally distributed.
- The data has a higher variance than a normal distribution.
Hint
The variance of the data cannot be determined from the QQ plot.
Answer
3
The QQ plot compares the observed data with the theoretical quantiles of a normal distribution. If the points lie close to the diagonal line, then the data is likely normally distributed.
All the information provided is based on the Probability & Statistics for Machine Learning & Data Science | Coursera from DeepLearning.AI


